Within Causation
When the Combined Data Tells the Wrong Story
The Berkeley admissions example shows how an overall pattern can change when the data are split into meaningful groups.
On this page
- What the overall admissions pattern seemed to show
- Why department level data changed the interpretation
- How to spot aggregation traps in other claims
Page outline Jump by section
Introduction
The University of California, Berkeley graduate admissions data from 1973 is the best-known real-world example of Simpson’s paradox: a situation in which an overall statistical pattern reverses after the data are divided into meaningful groups. At first glance, the combined admissions figures appeared to show that women were admitted at much lower rates than men. However, when researchers examined admissions department by department, that apparent pattern largely disappeared and, in several cases, even reversed. The lesson is not that discrimination was impossible, but that aggregate statistics alone can produce misleading causal stories when important differences between subgroups are ignored. This case has become a cornerstone of statistical thinking because it demonstrates why careful analysis must ask what is being combined before drawing conclusions about cause, fairness, or bias.[PubMed]pubmed.ncbi.nlm.nih.govSex bias in graduate admissions: data from berkeleyby PJ Bickel · 1975 · Cited by 977 — Examination of aggregate data on graduate a…

What the overall admissions pattern seemed to show
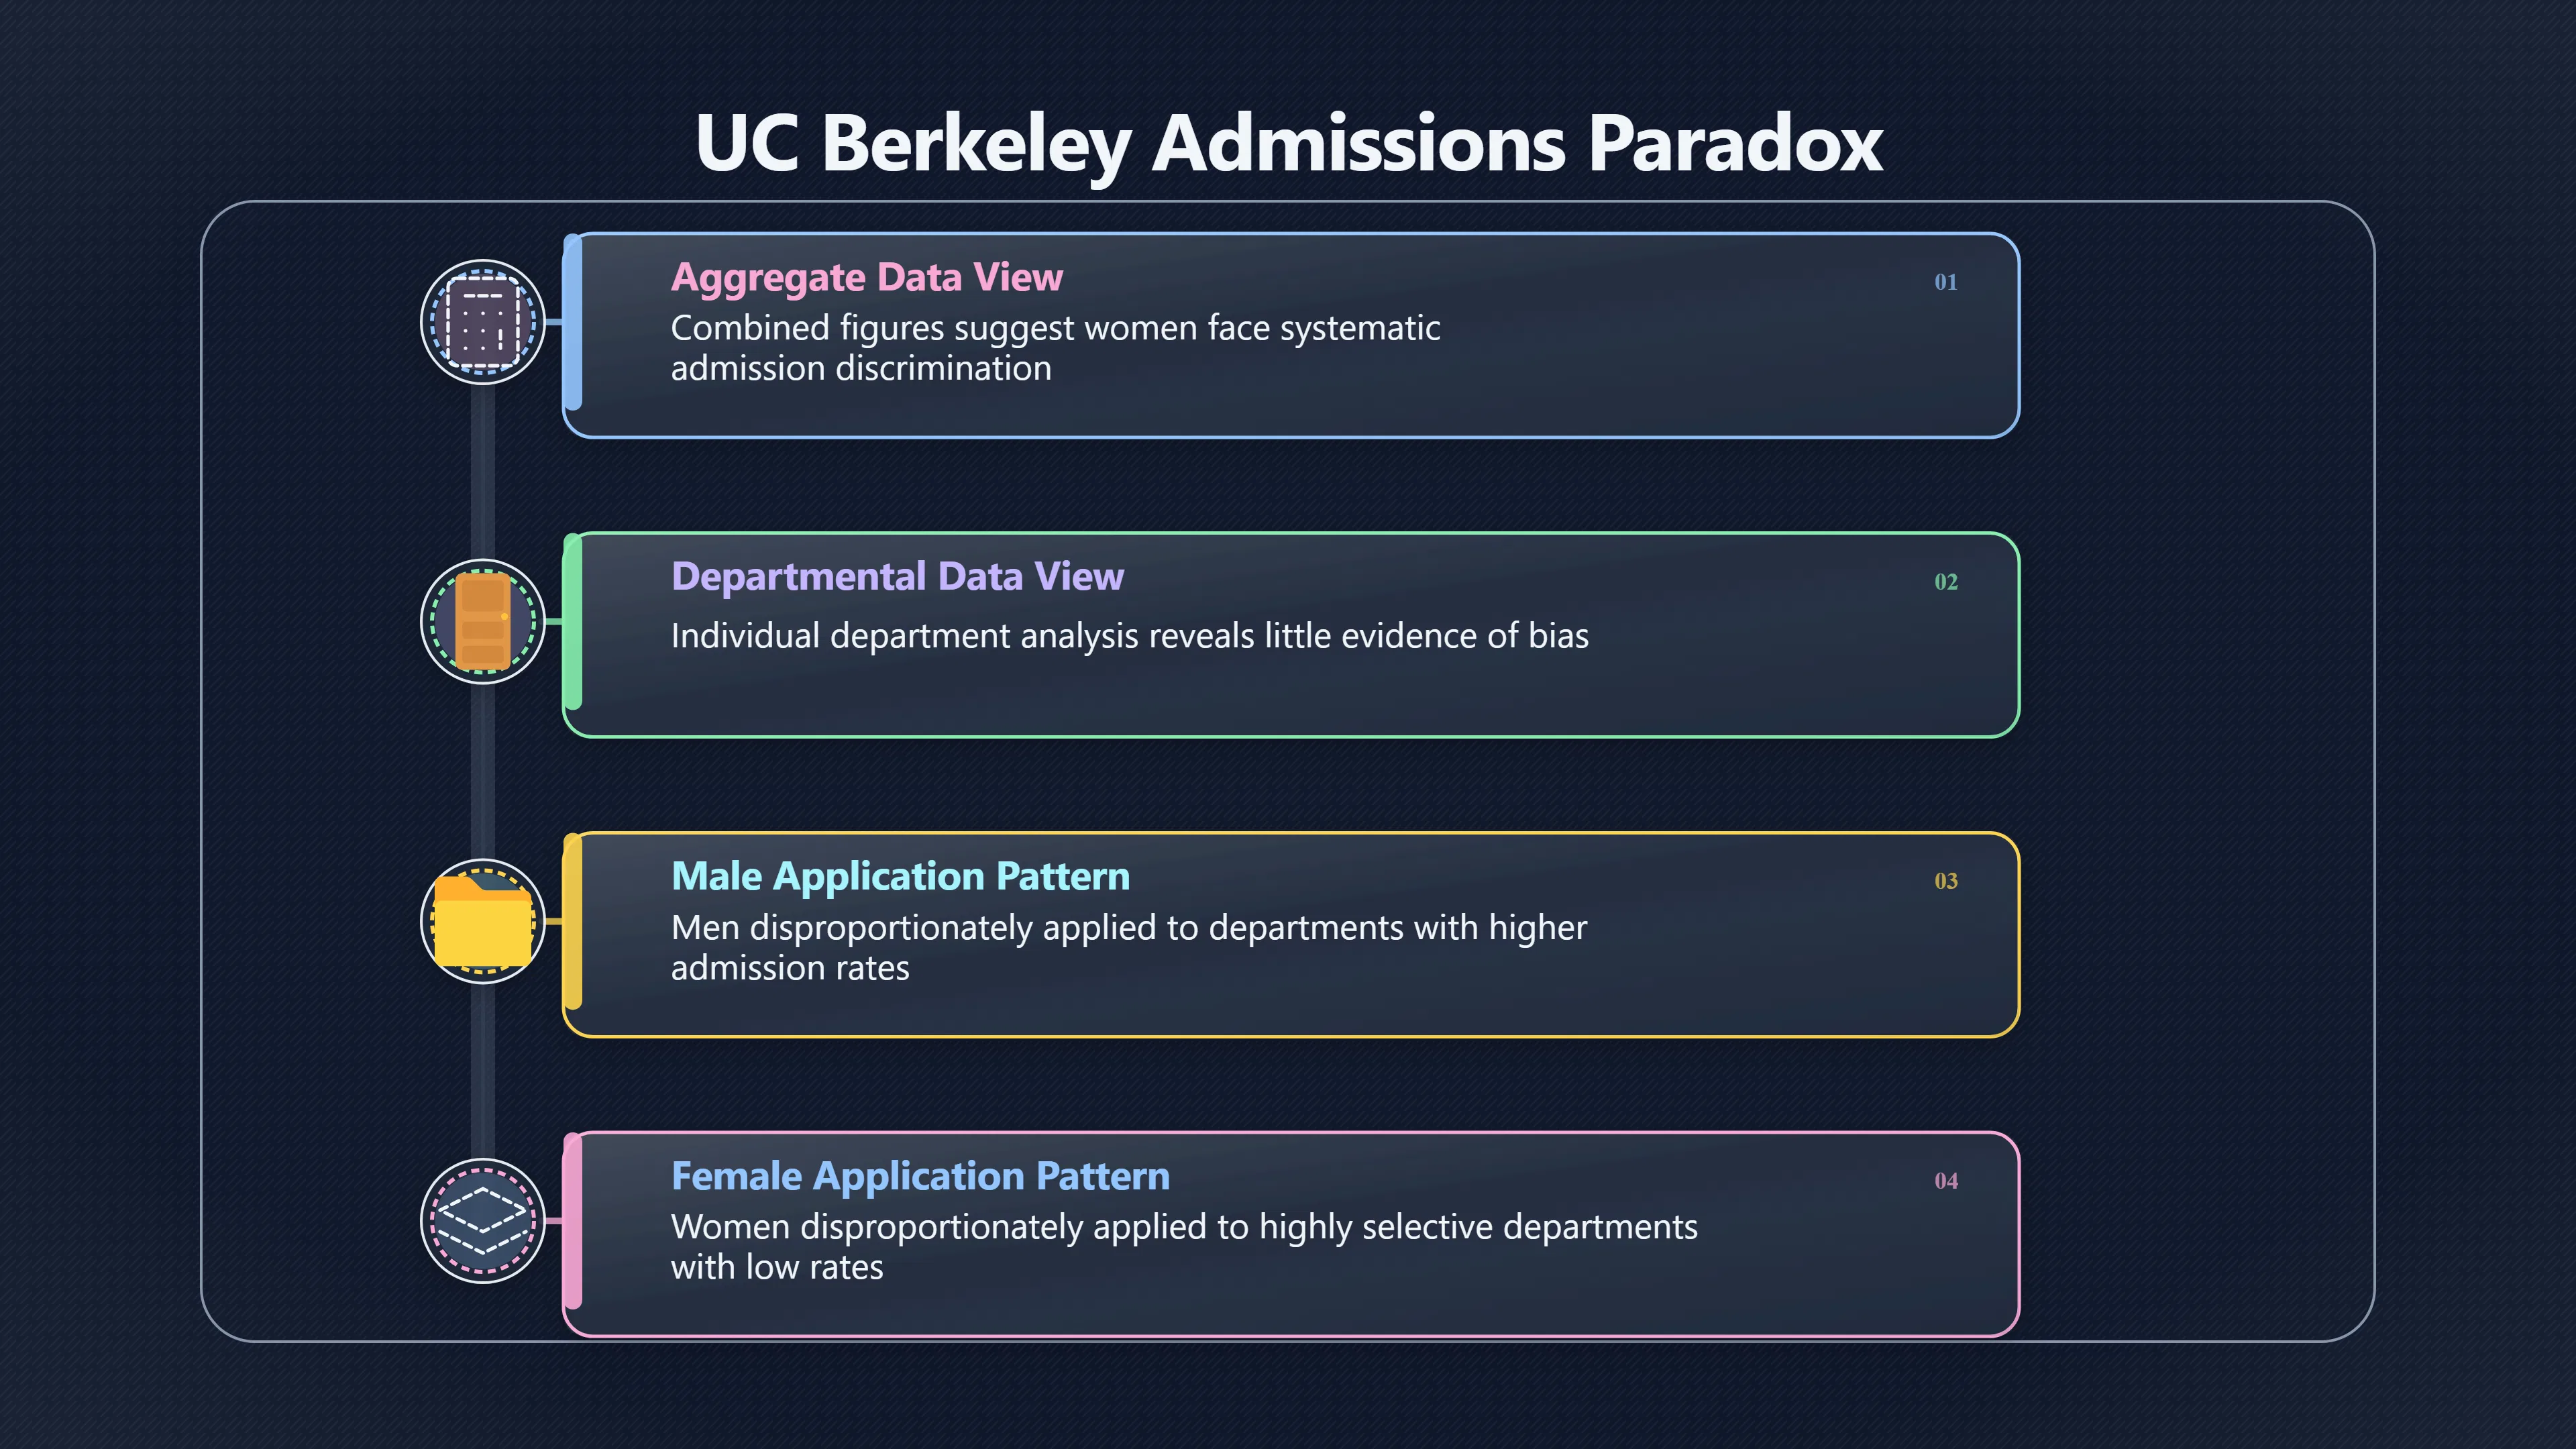
The controversy began with graduate admissions for the autumn of 1973. Across all departments combined, approximately 44% of male applicants were admitted compared with about 35% of female applicants. Viewed only at this level, the figures appeared to provide strong evidence that women faced systematic discrimination in admissions.[PubMed]pubmed.ncbi.nlm.nih.govSex bias in graduate admissions: data from berkeleyby PJ Bickel · 1975 · Cited by 977 — Examination of aggregate data on graduate a…
This aggregate result was especially persuasive because:
- the difference was large enough that it was unlikely to be explained by random chance alone;
- the data covered thousands of applicants rather than a small sample; and
- the comparison seemed straightforward: compare overall admission rates by gender.
Had the analysis stopped there, many readers would reasonably have concluded that Berkeley’s admissions process discriminated broadly against women.
Why department-level data changed the interpretation
The key insight came when statisticians analysed admissions separately for individual departments rather than pooling them together. Graduate departments made admissions decisions independently, and departments varied enormously in how selective they were.
Researchers found two important facts:
- Women disproportionately applied to departments with very low admission rates.
- Men disproportionately applied to departments with much higher admission rates.
Because of this difference in application patterns, combining every department into one overall statistic mixed together applicants facing very different admission odds. Once departments were examined individually, most showed little evidence of gender bias in admissions decisions, and some actually admitted women at slightly higher rates than comparable male applicants. The original paper concluded that the aggregate pattern suggesting bias against women was misleading because it ignored differences between departments.[PubMed]pubmed.ncbi.nlm.nih.govSex bias in graduate admissions: data from berkeleyby PJ Bickel · 1975 · Cited by 977 — Examination of aggregate data on graduate a…
The six largest departments illustrate the effect particularly well. In several departments, women had admission rates comparable with or higher than men’s, yet the overall total still showed women being admitted less frequently because many female applicants had concentrated in highly competitive programmes with very low acceptance rates.[Vincent Arel-Bundock's GitHub Projects]vincentarelbundock.github.ioVincent Arel-Bundock's GitHub ProjectsR: Student Admissions at UC BerkeleyThis data set is frequently used for illustrating Simpson's par…
This reversal is exactly what Simpson’s paradox describes: a trend that appears in the combined data but changes—or even reverses—after accounting for a relevant grouping variable.
Why this is not simply “proof there was no discrimination”
The Berkeley example is often oversimplified into the claim that “there was no discrimination.” That is not what the original research established.
The authors argued that the evidence did not support widespread department-level discrimination against women in admissions decisions themselves. They found relatively few departments with statistically significant departures from expected admissions rates, with roughly similar numbers appearing to favour women as to favour men.[PubMed]pubmed.ncbi.nlm.nih.govSex bias in graduate admissions: data from berkeleyby PJ Bickel · 1975 · Cited by 977 — Examination of aggregate data on graduate a…
However, the study did not claim that every aspect of graduate education was free from gender bias. Many other factors could influence who chose to apply to particular departments, including:
- differences in career expectations;
- barriers affecting earlier educational choices;
- departmental reputations;
- social and cultural influences on subject selection.
The paradox concerns how the admissions data should be interpreted statistically. It does not settle every broader question about gender equality in higher education.
What the Berkeley data teaches about causal thinking
The Berkeley admissions case illustrates an essential principle for better analytical reasoning: before explaining a statistical association, ask whether different populations have been merged together.
The overall admission rate depended on two separate processes:
- Which departments applicants chose.
- How each department selected applicants.
If department choice differs systematically between groups, then the overall admission rate reflects both processes simultaneously. Treating the combined figure as though it measured only admissions decisions mistakes correlation for explanation.
From a causal perspective, department choice acted as an important confounding variable. Ignoring it created an apparent relationship between gender and admissions that was largely explained by differences in where applicants applied. Modern causal analysis uses this example to show why identifying relevant causal structure is more important than relying on simple averages.[Wikipedia]WikipediaSimpson's paradoxSimpson's paradox
How to spot aggregation traps in other claims
The Berkeley example provides several practical questions that help identify when aggregated statistics may be misleading.
Ask whether meaningful subgroups exist. Different schools, hospitals, regions, customer segments or departments may operate under very different conditions.
Check whether the groups have different baseline rates. Simpson’s paradox requires substantial differences between subgroup outcomes. If every subgroup behaves similarly, aggregation is less likely to reverse the pattern.
Look for unequal group membership. If one population disproportionately enters easier or harder categories—as women did by applying more often to highly selective departments—the combined average can become misleading.
Compare both the pooled and separated data. Neither view is automatically correct. The appropriate level of analysis depends on the causal question being asked.
For example, a company might conclude that one sales team performs better overall. After separating results by territory difficulty, each team member could actually outperform their counterpart within comparable markets. Similarly, a medical treatment may appear superior overall because it was given more often to patients with milder illnesses, not because it was intrinsically more effective.
Why the Berkeley case remains influential
More than fifty years after the original study, the Berkeley admissions data continues to appear in statistics, economics, epidemiology, machine learning and fairness research because it captures a surprisingly common analytical mistake in a single dataset.
Its lasting importance is not that it produced a clever mathematical curiosity. Rather, it demonstrates a practical habit of mind: whenever a striking overall pattern appears, ask whether combining different groups has hidden the real explanation. That simple question often marks the difference between describing a correlation and understanding the process that produced it.[PubMed+2Statistics LibreTexts]pubmed.ncbi.nlm.nih.govSex bias in graduate admissions: data from berkeleyby PJ Bickel · 1975 · Cited by 977 — Examination of aggregate data on graduate a…
Amazon book picks
Further Reading
Books and field guides related to When the Combined Data Tells the Wrong Story. Use these as the next step if you want deeper reading beyond the article.
The Book of Why
Explains the distinction between correlation and causation that underlies Simpson's paradox and the Berkeley admissions example.
The Signal and the Noise
Discusses statistical thinking, data interpretation, and avoiding misleading patterns in real-world evidence.
How to Lie with Statistics
Shows how aggregated statistics and misleading presentations can produce incorrect conclusions.
Naked Statistics
Provides intuitive explanations of statistical concepts needed to recognize aggregation traps and misleading summaries.
eBay marketplace picks
Marketplace Samples
Example marketplace items related to this page. Use the search link to explore similar finds on eBay.




Endnotes
1.
Source: stats.libretexts.org
Title: 1.02: The Cautionary Tale of Simpsons Paradox
Link:https://stats.libretexts.org/Bookshelves/Applied_Statistics/Learning_Statistics_with_R_-A_tutorial_for_Psychology_Students_and_other_Beginners%28Navarro%29/01%3A_Why_Do_We_Learn_Statistics/1.02%3A_The_Cautionary_Tale_of_Simpsons_Paradox
Source snippet
This figure plots the admission rate for the 85 departments that had at least one female...Read more...
2.
Source: vincentarelbundock.github.io
Link:https://vincentarelbundock.github.io/Rdatasets/doc/datasets/UCBAdmissions.html
Source snippet
Vincent Arel-Bundock's GitHub ProjectsR: Student Admissions at UC BerkeleyThis data set is frequently used for illustrating Simpson's par...
3.
Source: Wikipedia
Title: Simpson’s paradox
Link:https://en.wikipedia.org/wiki/Simpson%27s_paradox
4.
Source: Wikipedia
Title: The Simpsons
Link:https://en.wikipedia.org/wiki/The_Simpsons
Source snippet
The SimpsonsThe Simpsons is an American animated sitcom created by Matt Groening and developed by Groening, James L. Brooks and Sam Si...
5.
Source: norsys.com
Link:https://www.norsys.com/netlibrary/nets/tut/Berkeley%20Admissions_tut.htm
6.
Source: youtube.com
Title: Are University Admissions Biased? | Simpson’s Paradox Part 2
Link:https://www.youtube.com/watch?v=E_ME4P9fQbo
Source snippet
Simpson's Paradox...
7.
Source: youtube.com
Title: Simpson’s Paradox
Link:https://www.youtube.com/watch?v=ebEkn-BiW5k
Source snippet
Covid-19 fatality rates and the UC Berkeley Gender Bias Study...
8.
Source: pubmed.ncbi.nlm.nih.gov
Link:https://pubmed.ncbi.nlm.nih.gov/17835295/
Source snippet
Sex bias in graduate admissions: data from berkeleyby PJ Bickel · 1975 · Cited by 977 — Examination of aggregate data on graduate a...
9.
Source: discovery.cs.illinois.edu
Link:https://discovery.cs.illinois.edu/dataset/berkeley/
Source snippet
illinois.eduBerkeley's 1973 Graduate Admissions DatasetResearch Paper: Sex Bias in Graduate Admissions: Data from Berkeley by P. J. Bicke...
10.
Source: philosophy.hku.hk
Link:https://philosophy.hku.hk/think/stat/simpson.php
Source snippet
hku.hk[T12] Simpson's paradoxThe source of the data used in this section is P. J. Bickel, E. A. Hammel and J. W. O'Connell (1975), "Sex b...
11.
Source: simpsons.fandom.com
Title: Simpsons Wiki
Link:https://simpsons.fandom.com/wiki/Simpsons_Wiki
Source snippet
Wiki | FandomWikisimpsons is an encyclopedia all about The Simpsons that anyone can edit. It has detailed artices of characters, episodes...
Additional References
12.
Source: researchgate.net
Link:https://www.researchgate.net/profile/Joseph-Alvarez-2/post/How-to-calculate-the-population-attributable-risk-when-there-are-multi-categorical-variables-and-confounding-variables/attachment/59d61d9879197b80779784d2/AS%3A271753836728321%401441802571341/download/SimpsonExamples%2B%281%29.pdf
Source snippet
Math 209 B Applied StatisticsSimpson's paradox refers to the reversal in the direction of an X versus Y relationship when controlling for...
13.
Source: setosa.io
Link:https://setosa.io/simpsons/
Source snippet
Simpson's ParadoxThe numbers looked pretty incriminating: the graduate schools had just accepted 44% of male applicants but only 35% of f...
14.
Source: hulu.com
Link:https://www.hulu.com/series/the-simpsons-c88bb35c-880b-437e-9187-ab59b52df1a2
Source snippet
Watch The Simpsons Streaming OnlineWatch The Simpsons and other popular TV shows and movies including new releases, classics, Hulu Origin...
15.
Source: brenocon.com
Link:https://brenocon.com/blog/2008/04/are-women-discriminated-against-in-graduate-admissions-simpsons-paradox-via-r-in-three-easy-steps/
Source snippet
J., Hammel, E. A., and O'Connell, J. W. (1975) Sex bias in graduate admissions: Data from Berkeley. Science, 187, 398–403. [PDF].Read more...
16.
Source: brookings.edu
Title: when average isnt good enough simpsons paradox in education and earnings
Link:https://www.brookings.edu/articles/when-average-isnt-good-enough-simpsons-paradox-in-education-and-earnings/
Source snippet
When average isn't good enough: Simpson's paradox in...Jul 29, 2015 — Of the 8,442 male applicants for the fall of 1973, 44 percent were...
17.
Source: aeon.co
Link:https://aeon.co/videos/how-a-statistical-paradox-helps-to-get-to-the-root-of-bias-in-college-admissions
Source snippet
n small data sets, but differs or reverses when those sets are combined into a larger...
18.
Source: refsmmat.com
Title: 2016 05 08 simpsons paradox berkeley
Link:https://www.refsmmat.com/posts/2016-05-08-simpsons-paradox-berkeley.html
Source snippet
J., Hammel, E. A., & O'Connell, J. W. (1975). Sex bias in graduate admissions: Data from Berkeley. Science, 187(4175), 398–404...Read more...
19.
Source: repository.upenn.edu
Link:https://repository.upenn.edu/bitstreams/e16c26f2-4284-4381-9644-14bffc9de924/download
Source snippet
upenn.eduSimpson's Paradoxby YH Ooi · 2004 · Cited by 4 — The third example of Simpson's paradox, involves a study of sex bias in graduat...
20.
Source: youtube.com
Title: How statistics can be misleading
Link:https://www.youtube.com/watch?v=sxYrzzy3cq8
Source snippet
Simpson's paradox Berkeley admissions statistics Are University Admissions Biased? | Simpson's Paradox Part 2 minutephysics...
21.
Source: arxiv.org
Link:https://arxiv.org/html/2502.10161v1
Source snippet
Revisiting the Berkeley Admissions data: Statistical Tests...The 1973 University of California, Berkeley graduate school admissions case...
Topic Tree