Within Alternatives
Is Demand Down or Data Broken?
A revenue change is easier to interpret when analytics, payment data, traffic, refunds, and channel comparisons tell the same story.
On this page
- Demand explanations versus measurement explanations
- Checks that separate tracking errors from customer behavior
- Why unaffected channels make useful comparisons
Page outline Jump by section
Introduction
A sudden fall in sales is tempting to interpret as evidence that customers no longer want a product. However, one of the most common rival explanations is that the business has stopped measuring sales correctly rather than stopped making them. Tracking failures, payment reporting problems, changes to analytics implementations, privacy restrictions, or broken checkout instrumentation can all make healthy demand appear to have collapsed. Conversely, genuine demand declines usually leave a consistent pattern across multiple independent data sources. Good analytical thinking therefore asks a simple question before explaining why sales fell: is demand actually down, or is the data broken?
 The strongest conclusion comes from comparing independent measurements rather than trusting a single dashboard. Revenue changes become much more convincing when analytics, payment systems, order databases, website traffic, refunds, and unaffected sales channels all point in the same direction.
Demand explanations versus measurement explanations
The same headline metric—a 25% drop in reported sales, for example—can arise from very different mechanisms.
A genuine demand decline reflects changes in customer behaviour. Possible causes include weaker consumer confidence, increased competition, seasonal effects, pricing changes, stock shortages, poorer marketing performance, or declining product appeal. These explanations predict observable changes in customer activity, such as fewer visitors, lower conversion rates, reduced repeat purchases, or falling order volumes across multiple reporting systems.
A measurement problem instead affects what the business records rather than what customers actually do. Examples include:
- Broken purchase or checkout tracking after a website update.
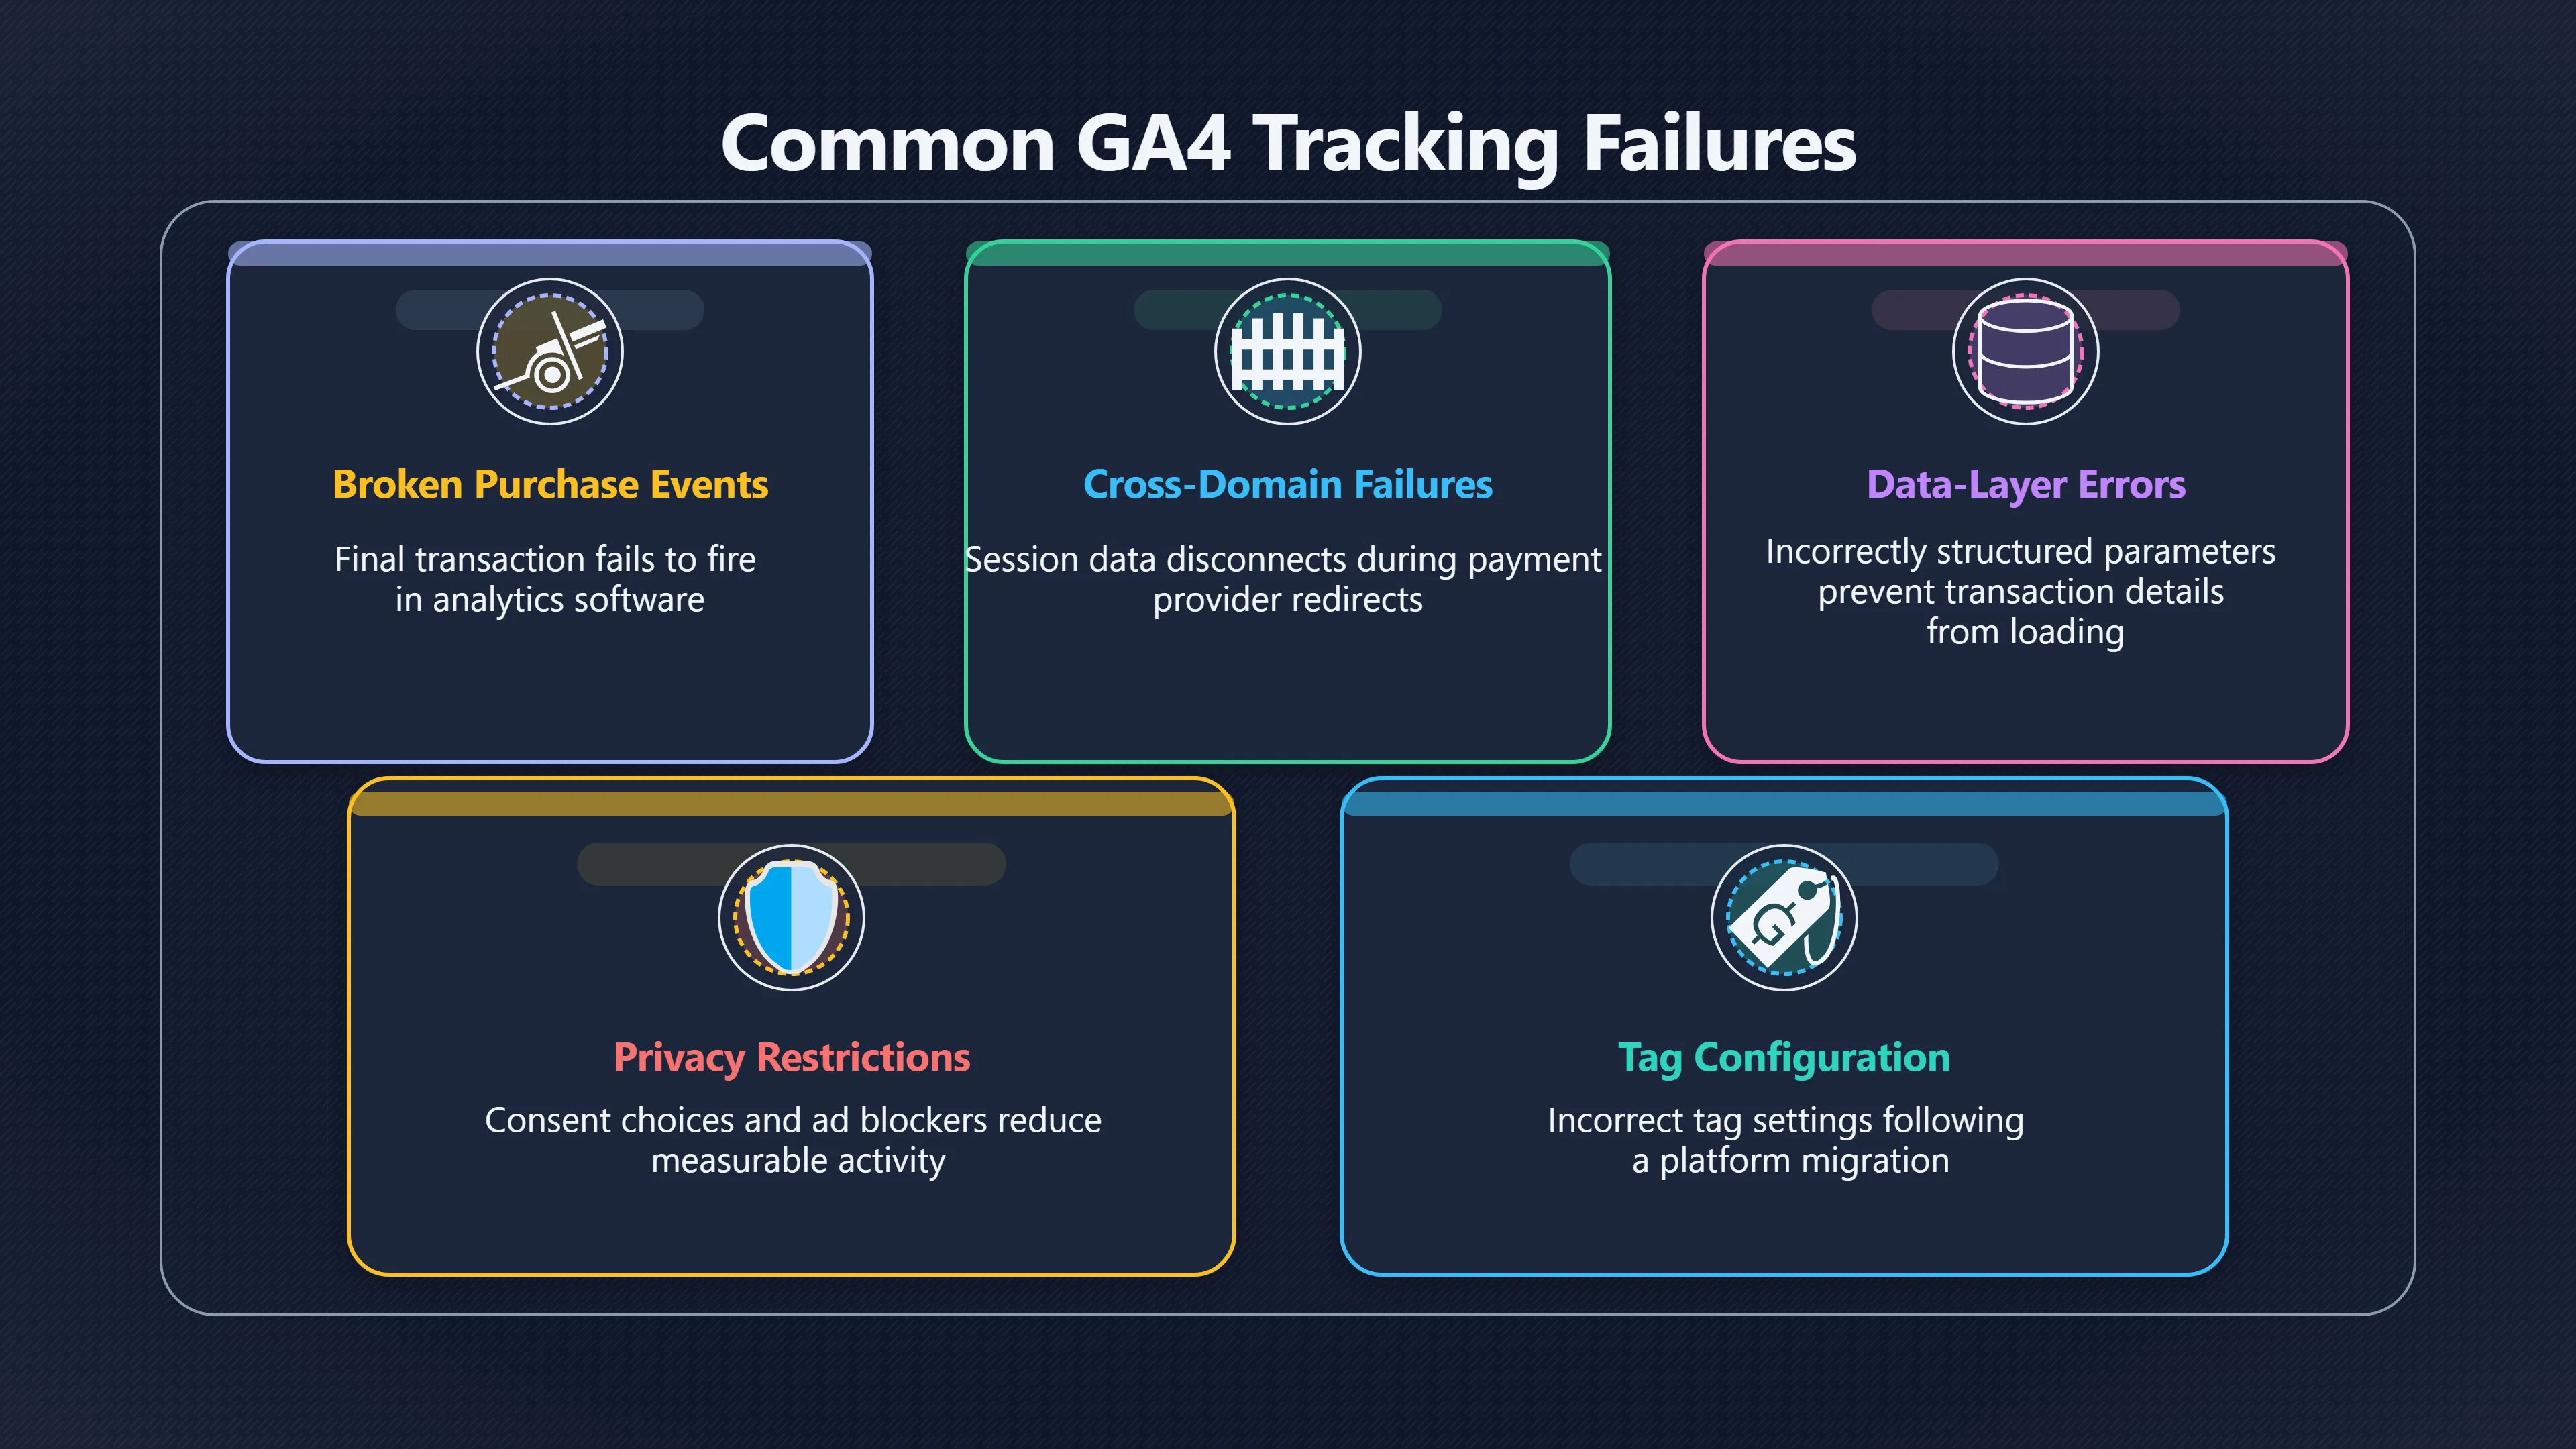
- Incorrect tag configuration following a migration to a new analytics platform.
- Missing ecommerce events in analytics software.[analyticsmania.com]analyticsmania.commissing google analytics transactionsAnalytics ManiaMissing Google Analytics 4 Transactions? Here are the…16 Dec 2025 — Learn how to identify and fix missing Google Analyt…
- Cross-domain tracking failures that disconnect sessions from completed purchases.
- Payment processor reporting delays.
- Data filtering mistakes or duplicate exclusions.
- Consent-management or browser privacy changes reducing measurable activity without reducing actual sales.[Simo Ahava's blog+2Analytics Mania]simoahava.comSimo Ahava's blog Google Analytics 4: Ecommerce Guide For Google TagSimo Ahava's blogGoogle Analytics 4: Ecommerce Guide For Google Tag…October 22, 2020 — 22 Oct 2020 — Guide to implementing Google Anal…
These rival explanations generate different predictions. If demand has genuinely weakened, multiple independent systems should agree. If only one measurement system shows the decline while accounting, fulfilment, or payment records remain stable, the measurement explanation becomes much more plausible.
Checks that separate tracking errors from customer behaviour
Rather than asking whether analytics “looks wrong”, it is more useful to compare evidence that was collected independently.
Compare financial records with analytics
Accounting systems, payment processors and order-management databases are usually generated independently from marketing analytics.
If analytics reports a 30% sales decline but:
- payment processor revenue is unchanged,
- order numbers remain stable,
- warehouse shipments continue at normal levels,
then the evidence suggests a tracking failure rather than collapsing demand.
Conversely, if every operational system reports fewer completed orders, the demand explanation becomes much stronger.
Examine the conversion funnel
Tracking failures rarely affect every customer interaction equally.
For example:
- product page views remain unchanged,
- add-to-cart events remain unchanged,
- checkout initiation remains unchanged,
- purchase events suddenly collapse.
This pattern is suspicious because customer behaviour would have to change dramatically at exactly one technical step. A broken purchase event, missing confirmation page, or failed analytics tag often explains such discontinuities better than a sudden shift in consumer preferences. Google recommends implementing ecommerce events consistently throughout the purchase journey because missing purchase events can distort reported revenue even when transactions succeed.[Simo Ahava's blog]simoahava.comSimo Ahava's blog Google Analytics 4: Ecommerce Guide For Google TagSimo Ahava's blogGoogle Analytics 4: Ecommerce Guide For Google Tag…October 22, 2020 — 22 Oct 2020 — Guide to implementing Google Anal…
Compare order counts with traffic
Demand declines usually affect multiple ratios simultaneously.
Examples include:
- fewer visitors and fewer sales,
- stable visitors but worse conversion,
- stable conversion but less qualified traffic.
A tracking problem often produces implausible combinations, such as:
- identical traffic,
- identical checkout behaviour,
- identical payment revenue,
- sharply lower reported purchases.
When only one metric changes, the measurement hypothesis deserves serious consideration.

Look for abrupt breaks
Customer demand usually changes gradually unless an identifiable external event occurs.
Measurement failures often begin at precise moments:
- immediately after deploying a new website,
- after changing tag management settings,
- following analytics migration,
- after installing a consent platform,
- after altering payment integrations.
A sharp discontinuity that coincides with a technical release is stronger evidence of instrumentation failure than changing customer preferences.
Why unaffected channels make useful comparisons
Independent comparison groups are among the strongest tools for distinguishing rival explanations.
Suppose an online retailer sells through:
- its own website,
- a marketplace,
- physical stores,
- a mobile application.
If only website analytics reports a collapse while marketplace sales, shop sales and mobile purchases remain stable, then the evidence points towards website-specific measurement or implementation issues rather than an economy-wide fall in demand.
Similarly, businesses operating across countries or brands can compare regions unaffected by recent technical changes. If only one region experiences the apparent decline immediately after a local website update, the technical explanation becomes considerably more credible.
This logic resembles a scientific control group. Unaffected channels help separate changes in customer behaviour from changes in measurement.

Common tracking failures that imitate falling sales
Several well-documented implementation problems can create the appearance of declining revenue.
Broken purchase events are among the most common. If the final purchase event fails to fire, customers complete orders successfully but analytics never records them.
Cross-domain tracking failures occur when customers leave the main website for a payment provider or checkout domain and return without preserving session information. Completed purchases may then become disconnected from their original customer journey.[SE Ranking]seranking.comga4 ecommerce guideSE RankingGA4 Ecommerce Guide for 202522 Feb 2024 — Learn how to set up GA4 ecommerce tracking to collect the most valuable insights on c…
Incorrect data-layer implementations can prevent transaction details from reaching analytics even though orders are processed correctly. GA4 implementations depend on correctly structured purchase events and parameters; errors in these implementations frequently produce incomplete or missing revenue reporting.[Simo Ahava's blog]simoahava.comSimo Ahava's blog Google Analytics 4: Ecommerce Guide For Google TagSimo Ahava's blogGoogle Analytics 4: Ecommerce Guide For Google Tag…October 22, 2020 — 22 Oct 2020 — Guide to implementing Google Anal…
Browser privacy protections, consent choices and ad blockers also reduce observable tracking. Modern analytics systems increasingly acknowledge that client-side measurement cannot capture every transaction perfectly, meaning discrepancies between analytics and backend financial systems are expected within reasonable limits.[Analytics Mania]analyticsmania.commissing google analytics transactionsAnalytics ManiaMissing Google Analytics 4 Transactions? Here are the…16 Dec 2025 — Learn how to identify and fix missing Google Analyt…
When the evidence points towards real demand decline
Not every apparent anomaly is a technical problem. Sometimes the simplest explanation survives because multiple independent indicators converge.
Evidence favouring genuine weakening demand includes:
- declining payment revenue alongside declining analytics revenue,
- fewer completed orders in backend systems,
- lower customer traffic,
- lower repeat purchasing,
- reduced search interest or campaign performance,
- similar declines across independent sales channels,
- competitor reports showing comparable market conditions.
Here the rival measurement hypothesis loses strength because independent systems are agreeing on the same outcome.
The key analytical principle is convergence. A conclusion becomes more convincing when several measurements collected through different mechanisms all support it.
Practical reasoning lessons
Sales data should be treated as evidence rather than as unquestionable fact. Every metric is produced by a measurement process that can fail.
Before concluding that customers have disappeared, ask:
- Which systems measure this outcome independently?
- Do accounting, payment, fulfilment and analytics agree?
- Did the change begin immediately after a technical deployment?
- Which customer behaviours changed first?
- Are unaffected channels showing the same pattern?
These questions embody a broader habit of analytical thinking: competing explanations should make different predictions, and the best explanation is the one that survives comparison with independent evidence. A reported sales decline is therefore strongest evidence of falling demand only when multiple unrelated measurements tell the same story.
Amazon book picks
Further Reading
Books and field guides related to Is Demand Down or Data Broken?. Use these as the next step if you want deeper reading beyond the article.
Lean Analytics
Explains how to validate metrics, distinguish signal from noise, and avoid misleading business conclusions.
Web Analytics 2.0
Covers measurement quality, cross-checking data sources, and interpreting business performance correctly.
How to Measure Anything
Provides practical frameworks for evaluating uncertain data and improving measurement quality.
Trustworthy Online Controlled Experiments
Emphasizes reliable measurement, instrumentation, and validating conclusions using robust evidence.
Endnotes
1.
Source: simoahava.com
Title: Simo Ahava’s blog Google Analytics 4: Ecommerce Guide For Google Tag
Link:https://www.simoahava.com/analytics/google-analytics-4-ecommerce-guide-google-tag-manager/
Source snippet
Simo Ahava's blogGoogle Analytics 4: Ecommerce Guide For Google Tag...October 22, 2020 — 22 Oct 2020 — Guide to implementing Google Anal...
Published: October 22, 2020
2.
Source: analyticsmania.com
Title: missing google analytics transactions
Link:https://www.analyticsmania.com/post/missing-google-analytics-transactions/
Source snippet
Analytics ManiaMissing Google Analytics 4 Transactions? Here are the...16 Dec 2025 — Learn how to identify and fix missing Google Analyt...
3.
Source: seranking.com
Title: ga4 ecommerce guide
Link:https://seranking.com/blog/ga4-ecommerce-guide/
Source snippet
SE RankingGA4 Ecommerce Guide for 202522 Feb 2024 — Learn how to set up GA4 ecommerce tracking to collect the most valuable insights on c...
Additional References
4.
Source: stape.io
Link:https://stape.io/blog/what-is-event-tracking-in-ga4-a-guide-to-boosting-your-data-insights
Source snippet
GA4 Event Tracking: Boost Data InsightsGA4 event tracking helps monitor user interactions, analyze data, and optimize marketing strategie...
5.
Source: medium.com
Link:https://medium.com/%40harekrishnapatel/google-analytics-4-for-ecommerce-ecommerce-tracking-set-up-b3b3cd5a6b14
Source snippet
Google Analytics 4 For eCommerce: Sales & Revenue...Google Analytics 4 for eCommerce is used to track how shoppers interact with your on...
6.
Source: optimizesmart.com
Link:https://optimizesmart.com/blog/ga4-ecommerce-tracking-via-gtm-step-by-step-setup-guide/
Source snippet
Learn how to track transactions, product views, and more for accurate ecommerce insights...
7.
Source: bidnamic.com
Title: What is ecommerce tracking?
Link:https://www.bidnamic.com/en-us/the-ultimate-guide-to-tags-and-tracking
Source snippet
The ultimate guide to tags...Ecommerce tracking is a Google Analytics feature which tracks all activity relating to shopping on your web...
8.
Source: improvado.io
Title: google ecommerce analytics
Link:https://improvado.io/blog/google-ecommerce-analytics
Source snippet
Complete Guide (2026)22 May 2026 — This guide walks through every step: setting up GA4 ecommerce tracking, configuring events and paramet...
Published: May 2026
9.
Source: youtube.com
Title: Analysis of Competing Hypotheses (ACH): Finding Plausible Answers
Link:https://www.youtube.com/watch?v=xt4EnzvGA4w
Source snippet
Analysis of Competing Hypotheses (ACH): A Structured Analytic Technique (SAT) for FinCrime...
10.
Source: tagada.io
Title: analytics in ecommerce
Link:https://www.tagada.io/blog/analytics-in-ecommerce
Source snippet
Learn key metrics and tracking architecture to boost your conversion and approval rates...
11.
Source: youtube.com
Title: Abduction (Inference to the Best Explanation)
Link:https://www.youtube.com/watch?v=7TeM7rBhRmw
Source snippet
Analysis of Competing Hypotheses (ACH): Finding Plausible Answers...
12.
Source: youtube.com
Link:https://www.youtube.com/watch?v=Y-J0FYOQRMY
Source snippet
Evidence Interpretation Diagnostics...
Topic Tree