Within Cause Check
When the Headline Average Gets It Wrong
Overall numbers can point one way while meaningful subgroups tell a different causal story.
On this page
- How aggregation reverses a pattern
- Berkeley admissions and case mix lessons
- Which subgroups deserve attention
Page outline Jump by section
Introduction
Simpson’s paradox is what happens when a headline statistic says one thing, while the meaningful subgroups say something different. It matters because many causal claims are made from averages: a school is “better”, a treatment “works”, a company “improved”, or a policy “reduced harm”. In messy outcomes, the average can be arithmetically correct and still analytically misleading.
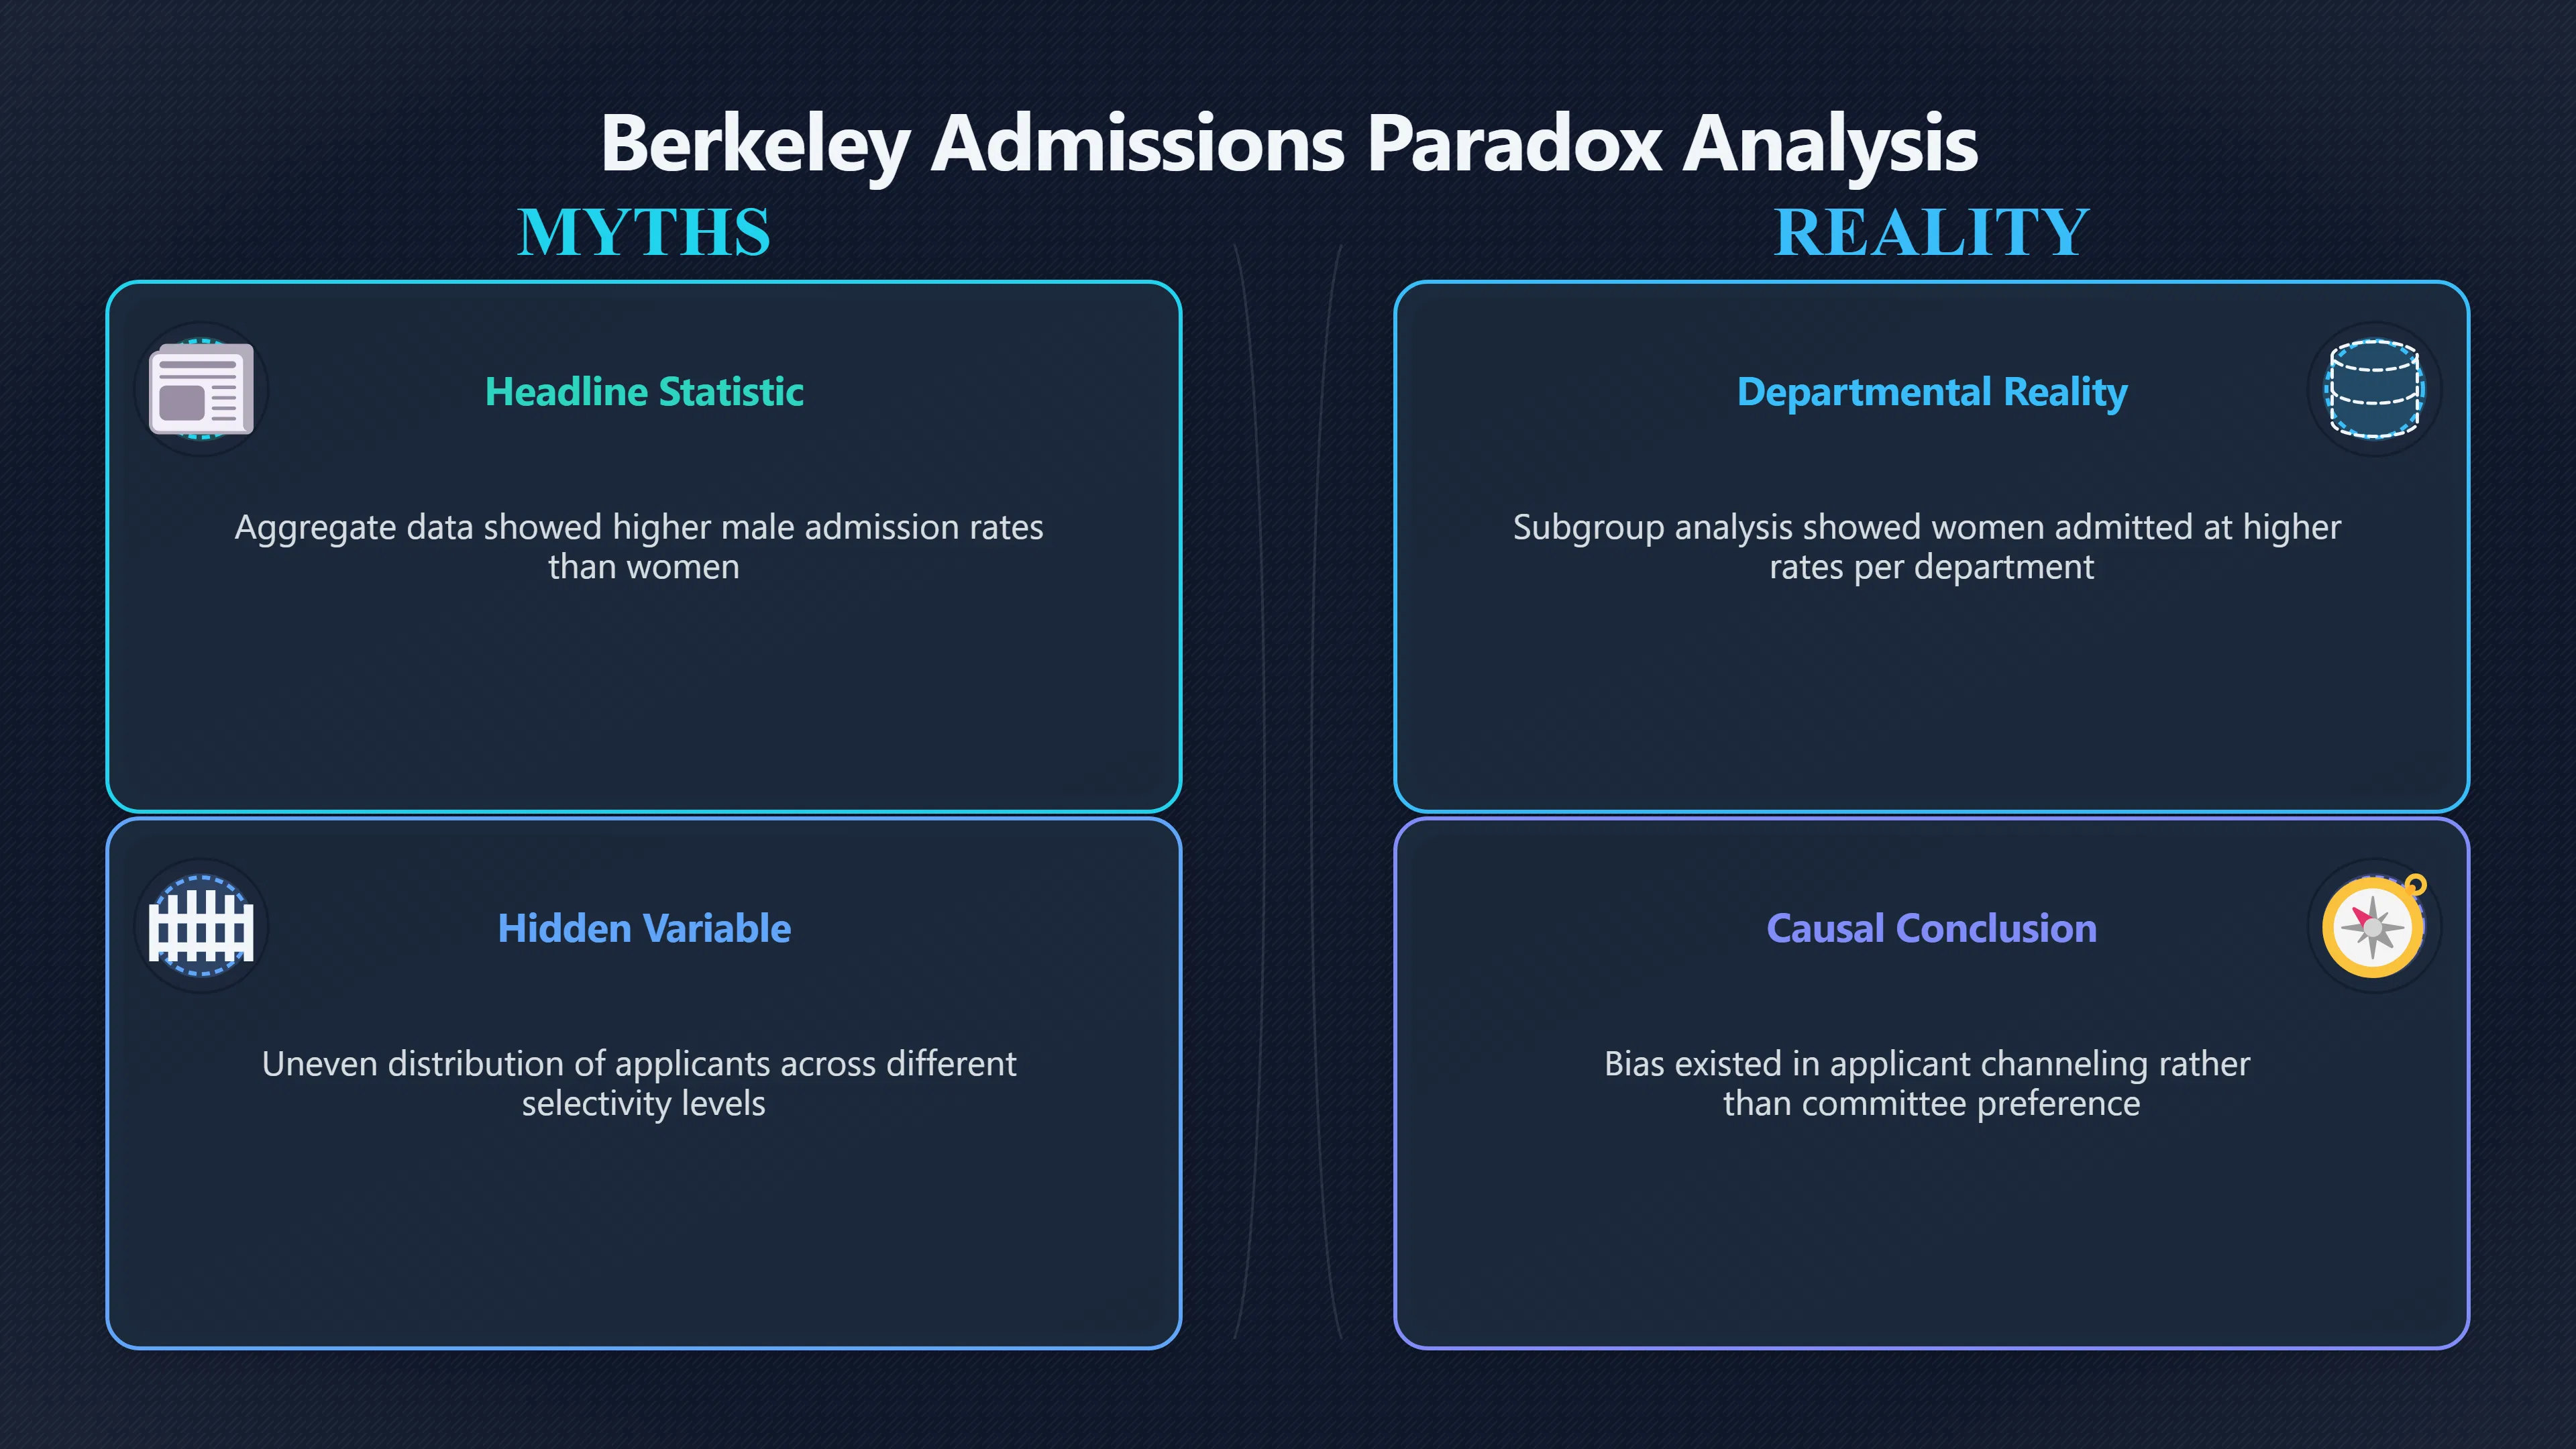
 The classic case is graduate admissions at the University of California, Berkeley in 1973. Overall, men were admitted at a higher rate than women. But when researchers examined departments separately, the apparent pattern against women largely disappeared, and in the properly pooled departmental analysis the evidence pointed slightly the other way. The headline had mixed together departments with very different admission rates and very different applicant patterns. [Science]science.orgSex Bias in Graduate Admissions: Data from Berkeleyby PJ Bickel · 1975 · Cited by 975 — Sex Bias in Graduate Admissions: Data from…
How aggregation reverses a pattern
Simpson’s paradox is not a mistake in arithmetic. It is a mistake in interpretation. A combined average is a weighted average, and the weights matter. If one group is over-represented in easier cases and another is over-represented in harder cases, the overall rate can reflect case mix more than treatment, skill, fairness or quality.
This is why the paradox is so dangerous in headline statistics. The aggregate number feels like the broadest and fairest view, but it may actually be blending unlike situations. Edward Simpson’s 1951 paper on contingency tables made the underlying point sharply: relationships between two classifications may be impossible to summarise properly without reference to a third. [JSTOR]jstor.orgThe Interpretation of Interaction in Contingency TablesThe Interpretation of Interaction in Contingency Tables - jstorJune 26, 1951 — In general it is impossible to summarize the relation…
A simple structure usually sits behind the reversal:
- A visible comparison: for example, men versus women, Treatment A versus Treatment B, or one school versus another.
- An outcome: admission, recovery, sales, test scores or survival.
- A hidden grouping variable: department, illness severity, customer type, year group, region or product mix.
- Uneven distribution across groups: one side is concentrated in easier or harder subgroups.
- Different baseline rates: the subgroups have very different chances of the outcome before the visible comparison is even considered.
The thinking error is to treat the headline average as if it answers a causal question. It usually answers only an accounting question: “What happened overall?” The causal question is narrower and harder: “What would have happened if comparable cases had been exposed to different choices?”
Berkeley admissions and case-mix lessons
The Berkeley admissions case is memorable because the first number looks so persuasive. In fall 1973, aggregate graduate admissions data showed a higher admission rate for male applicants than female applicants: roughly 44% for men and 35% for women in the full data reported by Bickel, Hammel and O’Connell. On its face, that seemed to support a claim of bias against women. [Science]science.orgSex Bias in Graduate Admissions: Data from Berkeleyby PJ Bickel · 1975 · Cited by 975 — Sex Bias in Graduate Admissions: Data from…
The problem was that graduate admissions were not one uniform queue. Applicants applied to departments, and departments differed greatly in selectivity. Women were more likely to apply to departments with lower admission rates, while men were more concentrated in departments with higher admission rates. Once the data were examined by department, the headline gap no longer supported the same causal story. [PubMed]pubmed.ncbi.nlm.nih.govSex bias in graduate admissions: data from berkeleyby PJ Bickel · 1975 · Cited by 975 — Women are shunted by their socialization an…
The six largest departments show the mechanism clearly. In the commonly reproduced Berkeley dataset, Department A admitted about 62% of male applicants and 82% of female applicants; Department B admitted about 63% of men and 68% of women; Department F admitted only about 6% of men and 7% of women. The crucial fact is not only the within-department rates, but the applicant mix: many more men applied to high-admission departments A and B, while many more women applied to lower-admission departments such as C, D, E and F. [Wikipedia]WikipediaSimpson's paradoxSimpson's paradox
That does not mean the Berkeley case proves there was no broader inequality. Bickel and colleagues explicitly pointed to a deeper social pattern: women were channelled towards fields that were more crowded and less favourable in several respects. The paradox changes the location of the question. It weakens the simple claim that admissions committees, taken as a single pooled process, directly preferred men; it raises a different question about why applicants were distributed across departments in the first place. [PubMed]pubmed.ncbi.nlm.nih.govSex bias in graduate admissions: data from berkeleyby PJ Bickel · 1975 · Cited by 975 — Women are shunted by their socialization an…

Which subgroups deserve attention
The lesson is not “always split the data”. Any dataset can be sliced into unhelpful categories. The useful question is whether a subgroup changes the fairness of the comparison. In Berkeley admissions, department mattered because it shaped both the chance of admission and the gender composition of applicants. In medicine, severity of illness often matters for the same reason: sicker patients may be more likely to receive an aggressive treatment and less likely to recover, making the treatment look worse in the aggregate.
A subgroup deserves attention when it meets three tests:
- It affects the outcome. Department selectivity affects admission rates; illness severity affects survival; prior attainment affects exam results.
- It is unevenly distributed across the compared groups. If both sides have the same mix, aggregation is less dangerous.
- It belongs in the causal story. The subgroup should not merely be statistically convenient; it should represent a real pathway, selection process or baseline difference.
This is why Simpson’s paradox connects directly to better causal thinking. The answer is not to distrust every average, but to ask what the average is averaging over. A headline statistic is a starting point. Before using it to argue that something caused something else, inspect the case mix.
The practical thinking habit
When a headline average seems to settle a causal argument, pause and ask: “Compared within what?” That question often reveals the hidden structure of the data.
For a school league table, compare pupils with similar starting points. For hospital outcomes, compare patients with similar risks. For workplace productivity, compare similar roles, teams and market conditions. For admissions, compare applicants within the decision units that actually assess them. The point is not to make the data say the opposite; it is to find the comparison that matches the real decision process.
Simpson’s paradox is powerful because it shows how a true number can support a false story. The aggregate may be accurate, but the causal claim may still be wrong. Better thinking begins by separating those two things.

Amazon book picks
Further Reading
Books and field guides related to When the Headline Average Gets It Wrong. Use these as the next step if you want deeper reading beyond the article.
The Art of Statistics
Covers interpretation of data, confounding, subgroup analysis, and careful reasoning about evidence.
The Book of Why
Explains why averages and associations can mislead, providing the conceptual foundation behind Simpson's paradox.
How to Lie with Statistics
Shows how aggregate statistics and presentation choices can create misleading conclusions.
Naked Statistics
Helps readers understand why summary statistics can hide important underlying patterns.
eBay marketplace picks
Marketplace Samples
Live-tested eBay searches with available results related to this page.


Endnotes
-
Source: jstor.org
Title: The Interpretation of Interaction in Contingency Tables
Link: https://www.jstor.org/stable/2984065Source snippet
The Interpretation of Interaction in Contingency Tables - jstorJune 26, 1951 — In general it is impossible to summarize the relation...
Published: June 26, 1951
-
Source: Wikipedia
Title: Simpson’s paradox
Link: https://en.wikipedia.org/wiki/Simpson%27s_paradox -
Source: jstor.org
Title: Interactions in Multi-Factor Contingency Tables
Link: https://www.jstor.org/stable/2983765 -
Source: jstor.org
Link: https://www.jstor.org/stable/24591584 -
Source: science.org
Link: https://www.science.org/doi/10.1126/science.187.4175.398Source snippet
Sex Bias in Graduate Admissions: Data from Berkeleyby PJ Bickel · 1975 · Cited by 975 — Sex Bias in Graduate Admissions: Data from...
-
Source: pubmed.ncbi.nlm.nih.gov
Link: https://pubmed.ncbi.nlm.nih.gov/17835295/Source snippet
Sex bias in graduate admissions: data from berkeleyby PJ Bickel · 1975 · Cited by 975 — Women are shunted by their socialization an...
-
Source: pmc.ncbi.nlm.nih.gov
Link: https://pmc.ncbi.nlm.nih.gov/articles/PMC8870532/ -
Source: pubmed.ncbi.nlm.nih.gov
Link: https://pubmed.ncbi.nlm.nih.gov/29484824/ -
Source: pmc.ncbi.nlm.nih.gov
Link: https://pmc.ncbi.nlm.nih.gov/articles/PMC2266743/ -
Source: pmc.ncbi.nlm.nih.gov
Link: https://pmc.ncbi.nlm.nih.gov/articles/PMC9960320/ -
Source: philosophy.hku.hk
Link: https://philosophy.hku.hk/think/stat/simpson.php -
Source: discovery.cs.illinois.edu
Link: https://discovery.cs.illinois.edu/dataset/berkeley/
Additional References
-
Source: aeon.co
Title: how a statistical paradox helps to get to the root of bias in college admissions
Link: https://aeon.co/videos/how-a-statistical-paradox-helps-to-get-to-the-root-of-bias-in-college-admissionsSource snippet
How a statistical paradox helps to get to the root of bias in college admissions | Aeon VideosBerkeley in 1973, when roughly 44 per c...
-
Source: brookings.edu
Title: when average isnt [good enough]({{ ‘good-enough/’ | relative_url }}) simpsons paradox in education and earnings
Link: https://www.brookings.edu/articles/when-average-isnt-good-enough-simpsons-paradox-in-education-and-earnings/Source snippet
When average isn't good enough: Simpson's paradox in...29 Jul 2015 — In the Berkeley case, the “paradox” occurred because women...
-
Source: youtu.be
Link: https://youtu.be/FDF_Q3_98GQSource snippet
"Overfitting vs Underfitting: [https://youtu.be/B9rhzg6_LLw](https://youtu.be/B9rhzg6_LLw) Why Models Overfit and Underfit - The Bias Variance Trade-off: [https://youtu.be..."](https://youtu.be...")...
-
Source: youtu.be
Link: https://youtu.be/N_RQj4OL1mgSource snippet
Cross-Entropy - Explained: [https://youtu.be/Fv98vtitmiA](https://youtu.be/Fv98vtitmiA) Dropout - Explained: [https://youtu.be/FDF_Q3_98GQ](https://youtu.be/FDF_Q3_98GQ) Overfitting vs Underfitting: ht...
-
Source: youtu.be
Link: https://youtu.be/5mbX6ITznHkSource snippet
"Least Squares vs Maximum Likelihood: [https://youtu.be/WCP98USBZ0w](https://youtu.be/WCP98USBZ0w) XGBoost Explained in Under 3 Minutes: [https://youtu.be/33fGfuleXw0..."](https://youtu.be/33fGfuleXw0...")...
-
Source: youtu.be
Link: https://youtu.be/G-fXV-o9QV8Source snippet
"The Kernel Trick: [https://youtu.be/N_RQj4OL1mg](https://youtu.be/N_RQj4OL1mg) Cross-Entropy - Explained: [https://youtu.be/Fv98vtitmiA](https://youtu.be/Fv98vtitmiA) Dropout - Explained: [https://youtu..."](https://youtu...")...
-
Source: youtu.be
Link: https://youtu.be/B9rhzg6_LLwSource snippet
"Why Models Overfit and Underfit - The Bias Variance Trade-off: [https://youtu.be/5mbX6ITznHk](https://youtu.be/5mbX6ITznHk) Least Squares vs Maximum Likelihood: [https://..."](https://...")...
-
Source: youtu.be
Link: https://youtu.be/Fv98vtitmiASource snippet
Dropout - Explained: [https://youtu.be/FDF_Q3_98GQ](https://youtu.be/FDF_Q3_98GQ) Overfitting vs Underfitting: [https://youtu.be/B9rhzg6_LLw](https://youtu.be/B9rhzg6_LLw) Why Models Overfit and Underf...
-
Source: youtu.be
Title: Why Models Overfit and Underfit
Link: https://youtu.be/WCP98USBZ0wSource snippet
"XGBoost Explained in Under 3 Minutes: [https://youtu.be/33fGfuleXw0..."](https://youtu.be/33fGfuleXw0...")...
-
Source: youtu.be
Link: https://youtu.be/Kq6_kzlwSUQSource snippet
Hyperparameters Tuning: Grid Search vs Random Search: [https://youtu.be/G-fXV-o9QV8](https://youtu.be/G-fXV-o9QV8) The Kernel Trick: [https://youtu.be/N_RQj4OL1mg](https://youtu.be/N_RQj4OL1mg) Cross-E...
Topic Tree